
📋 Get a deeper insight into your transactions.
Accessing the Report
The following guide elaborates on how to access the analytic report step by step.
- Click on the Report menu.
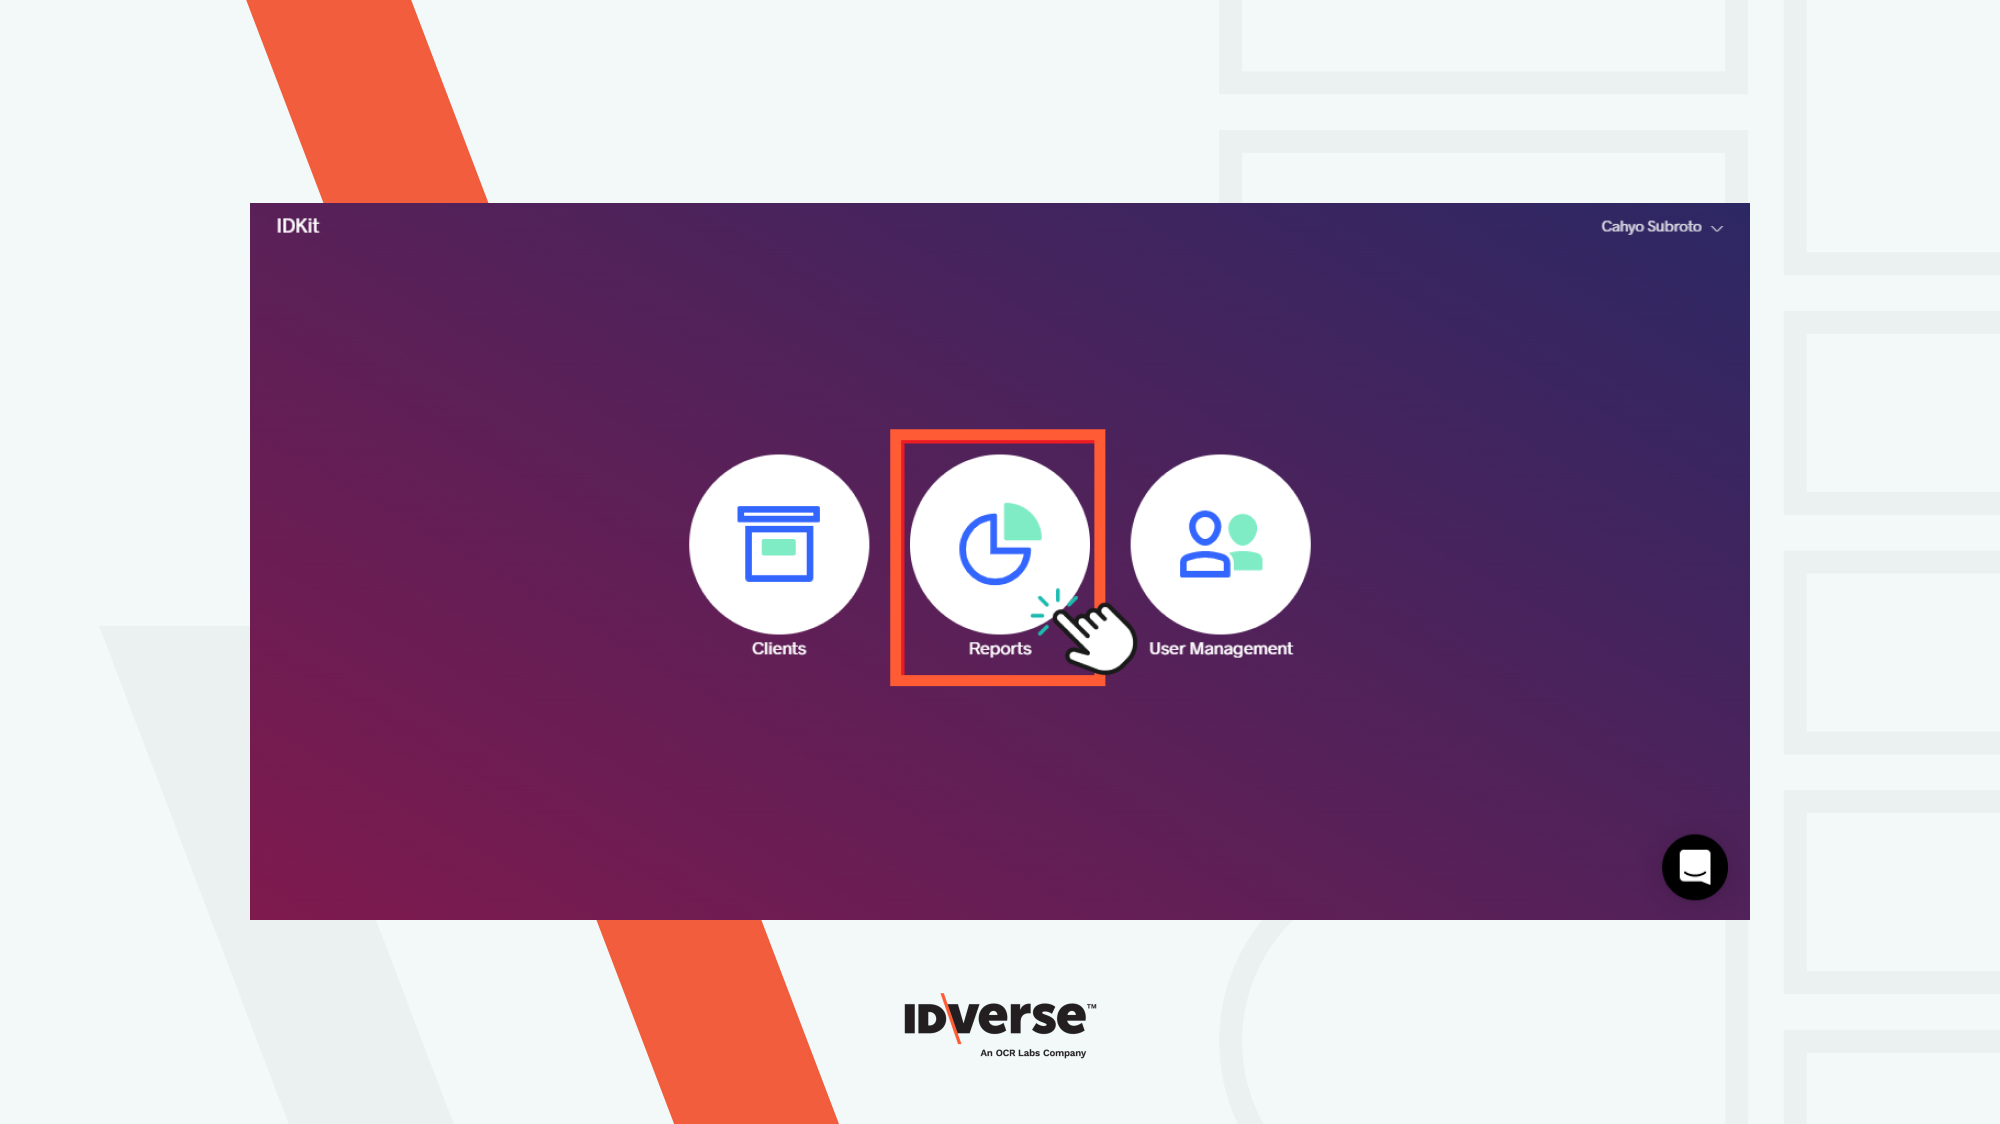
- The Usage Report page will appear first when you click the Reports menu icon. Set the page to Analytics.
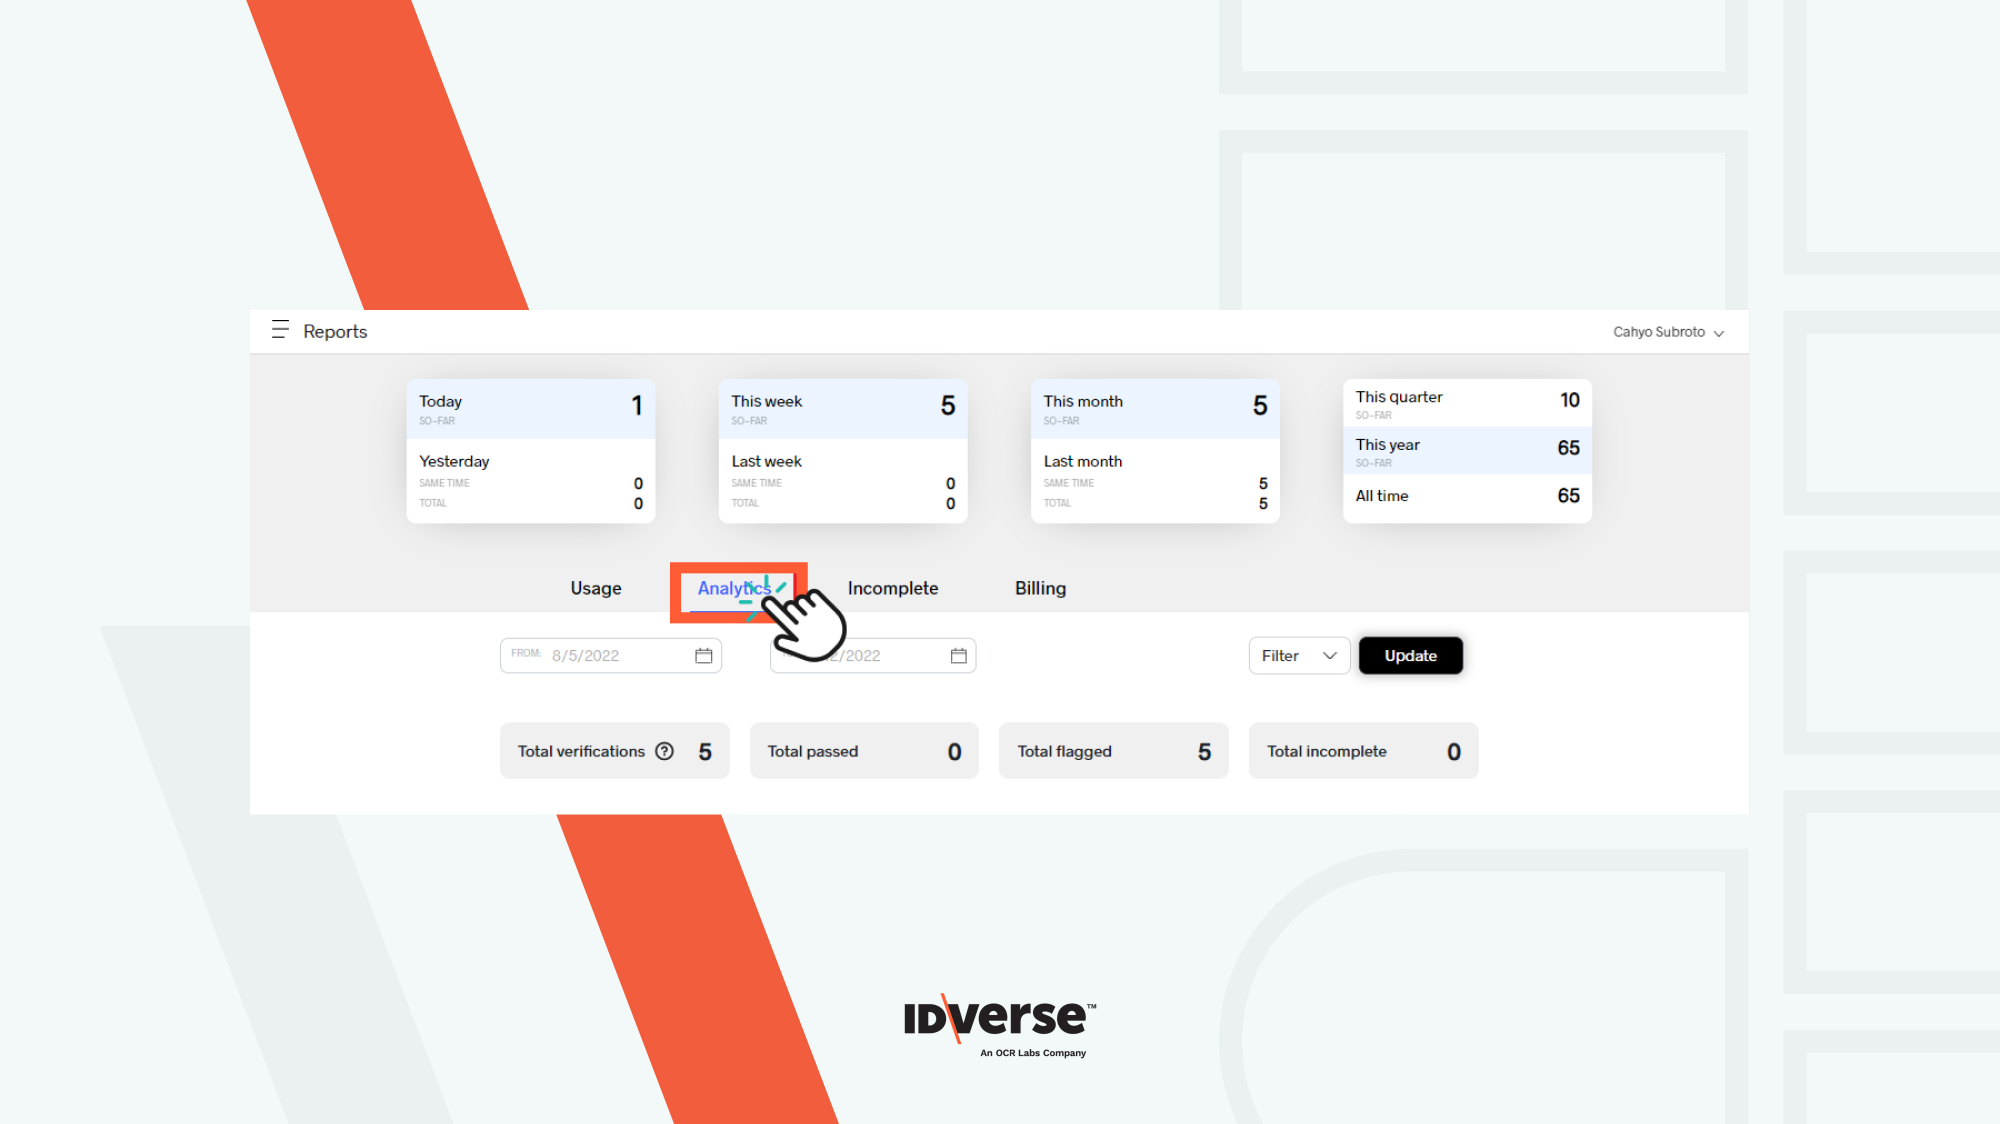
The Analytic Report Features
You are already on the Analytic Report page now. Now, let's explore what this page can cover.
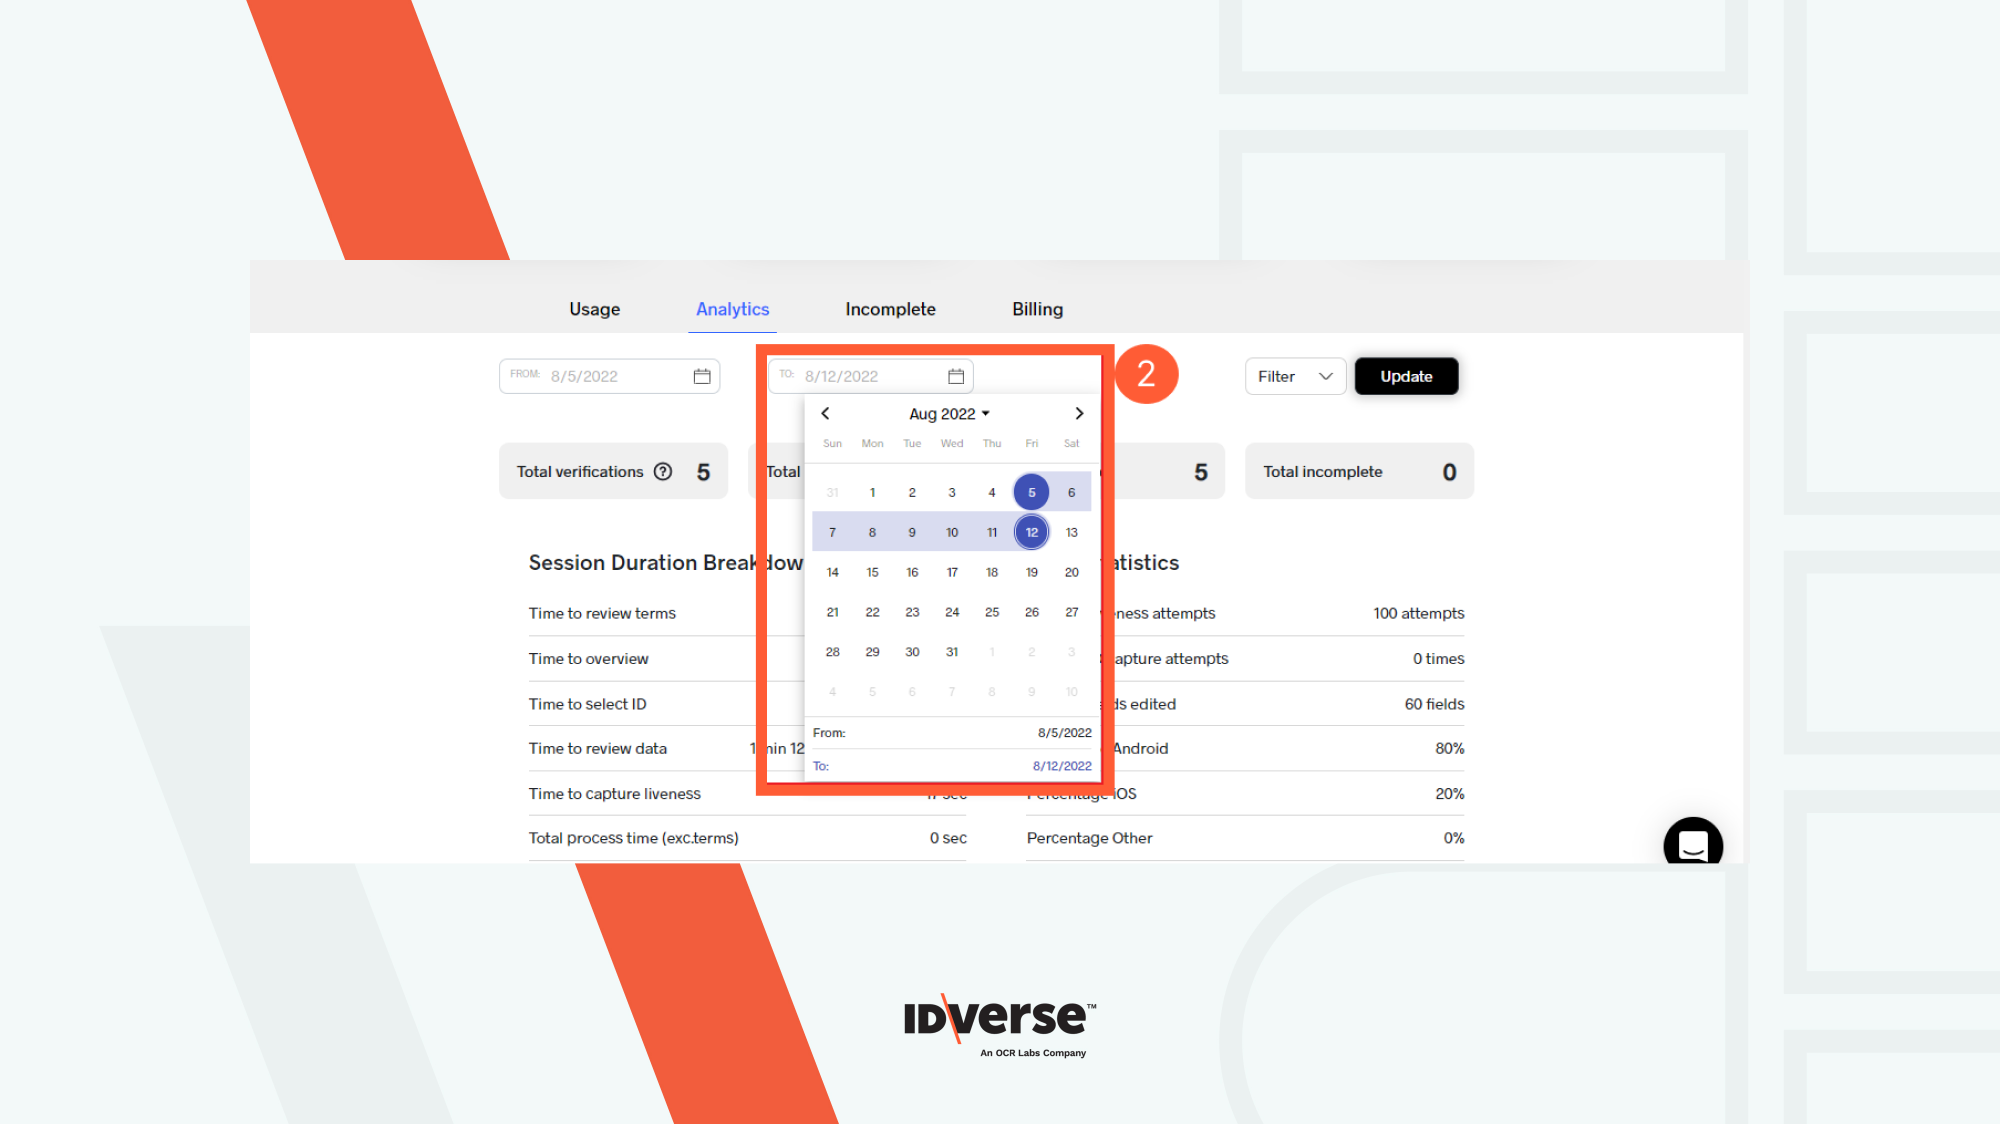
Range of Date Setting
You can adjust the start and end dates of the verifications you want to analyze. Follow the steps below to change the Date Range settings.
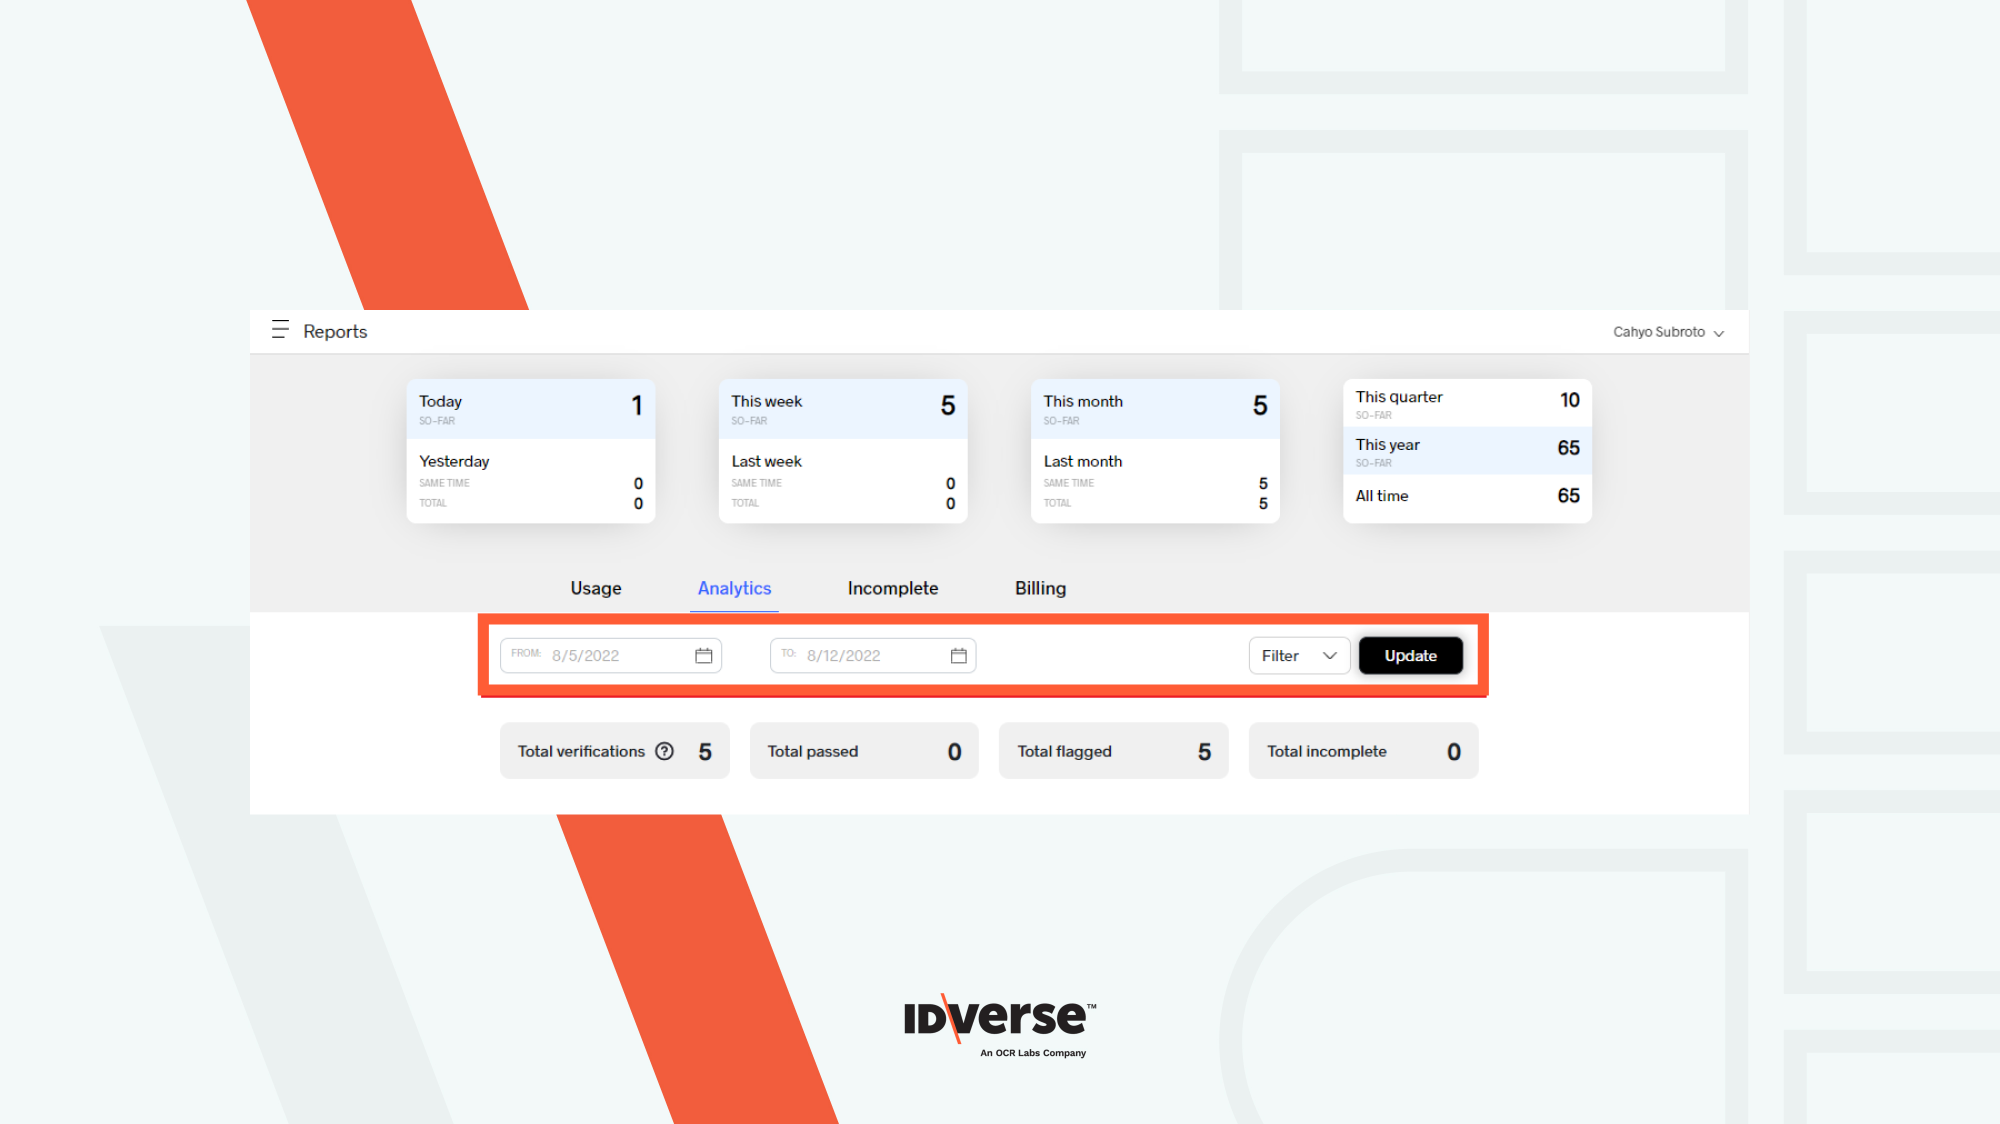
- Click on the From field to set the starting date. A calendar will pop out so you can easily select the date.
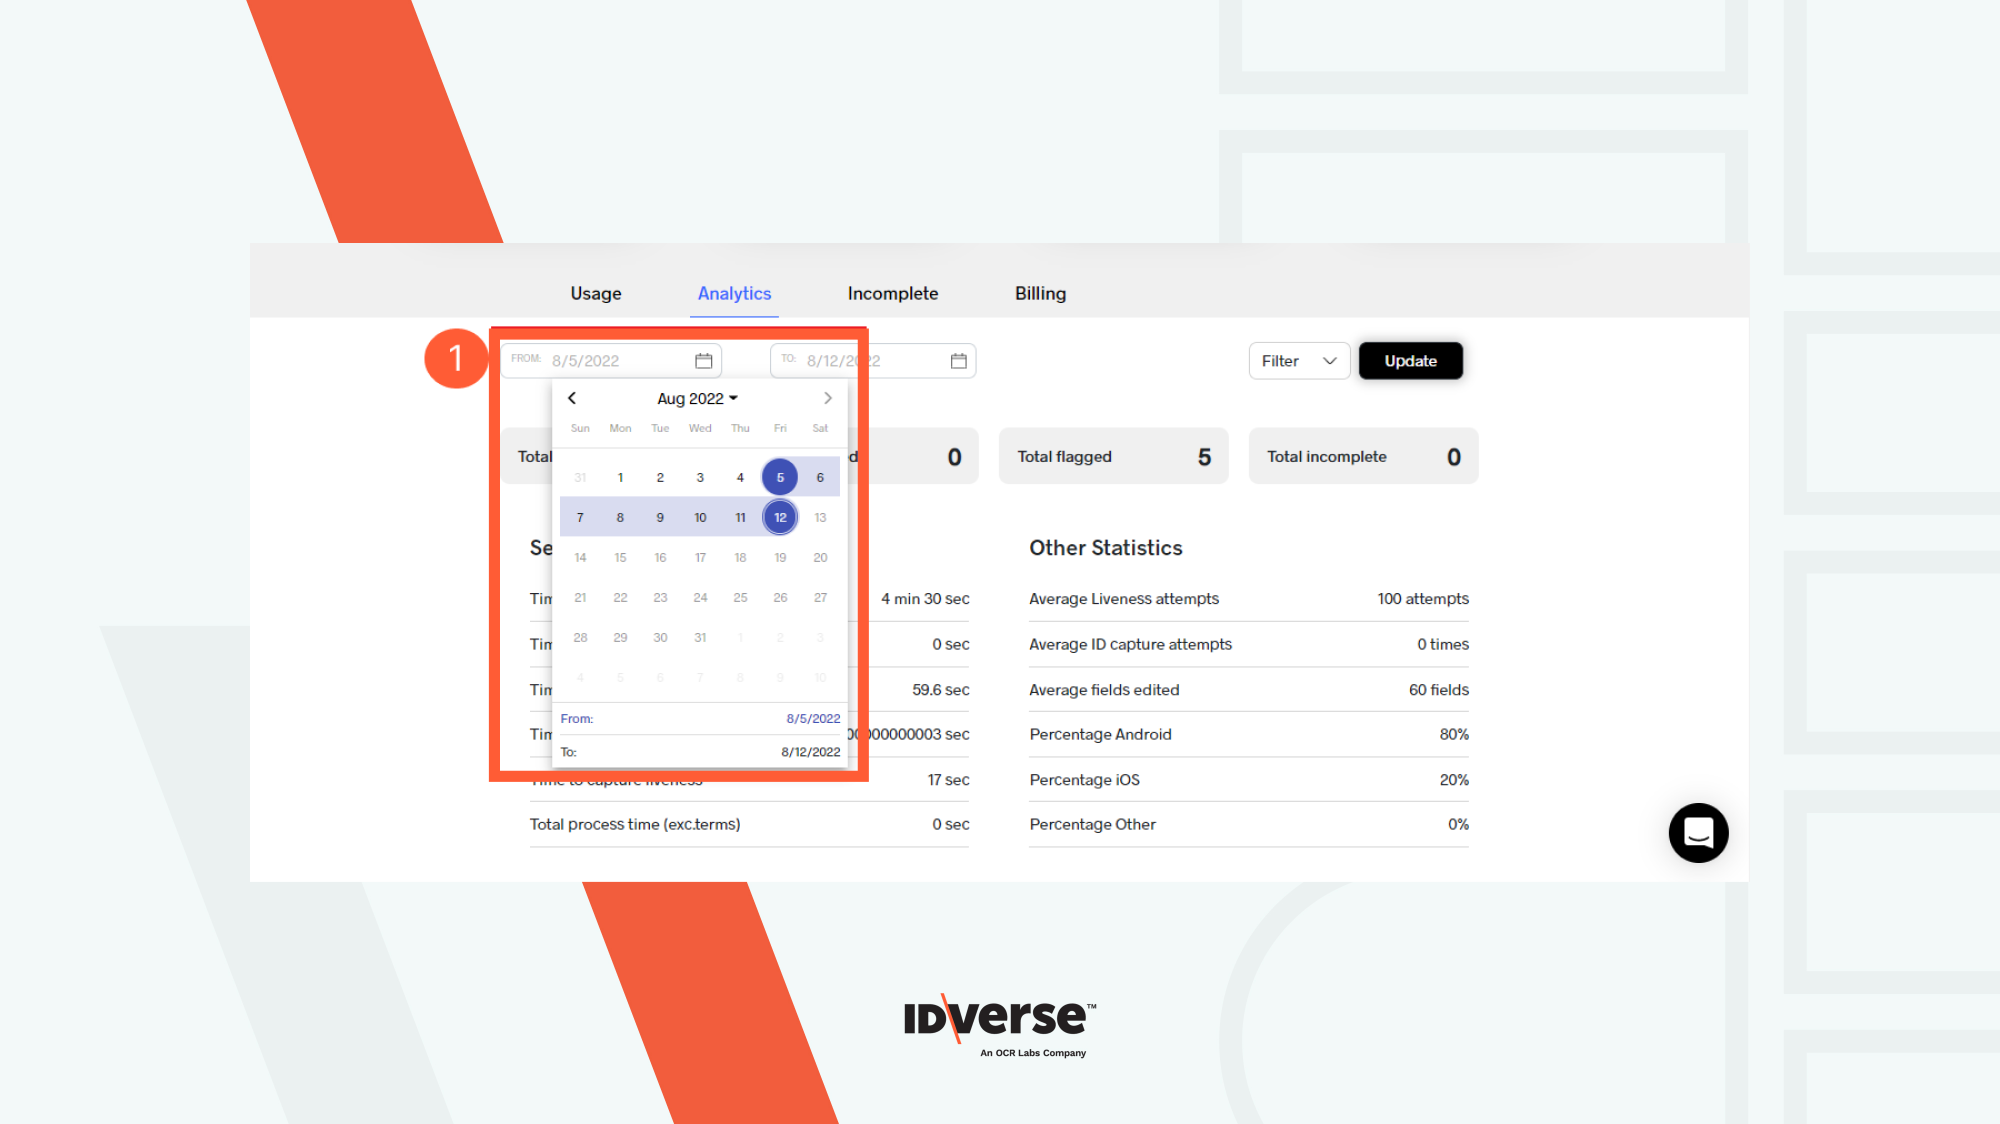
- Set the ending date by picking the date on the To pop-up calendar.
Client Filter
On the right side of the date setting column, you will spot the Filter dropdown. You can use it to filter which clients' verifications to analyze. Select one of the clients to start.
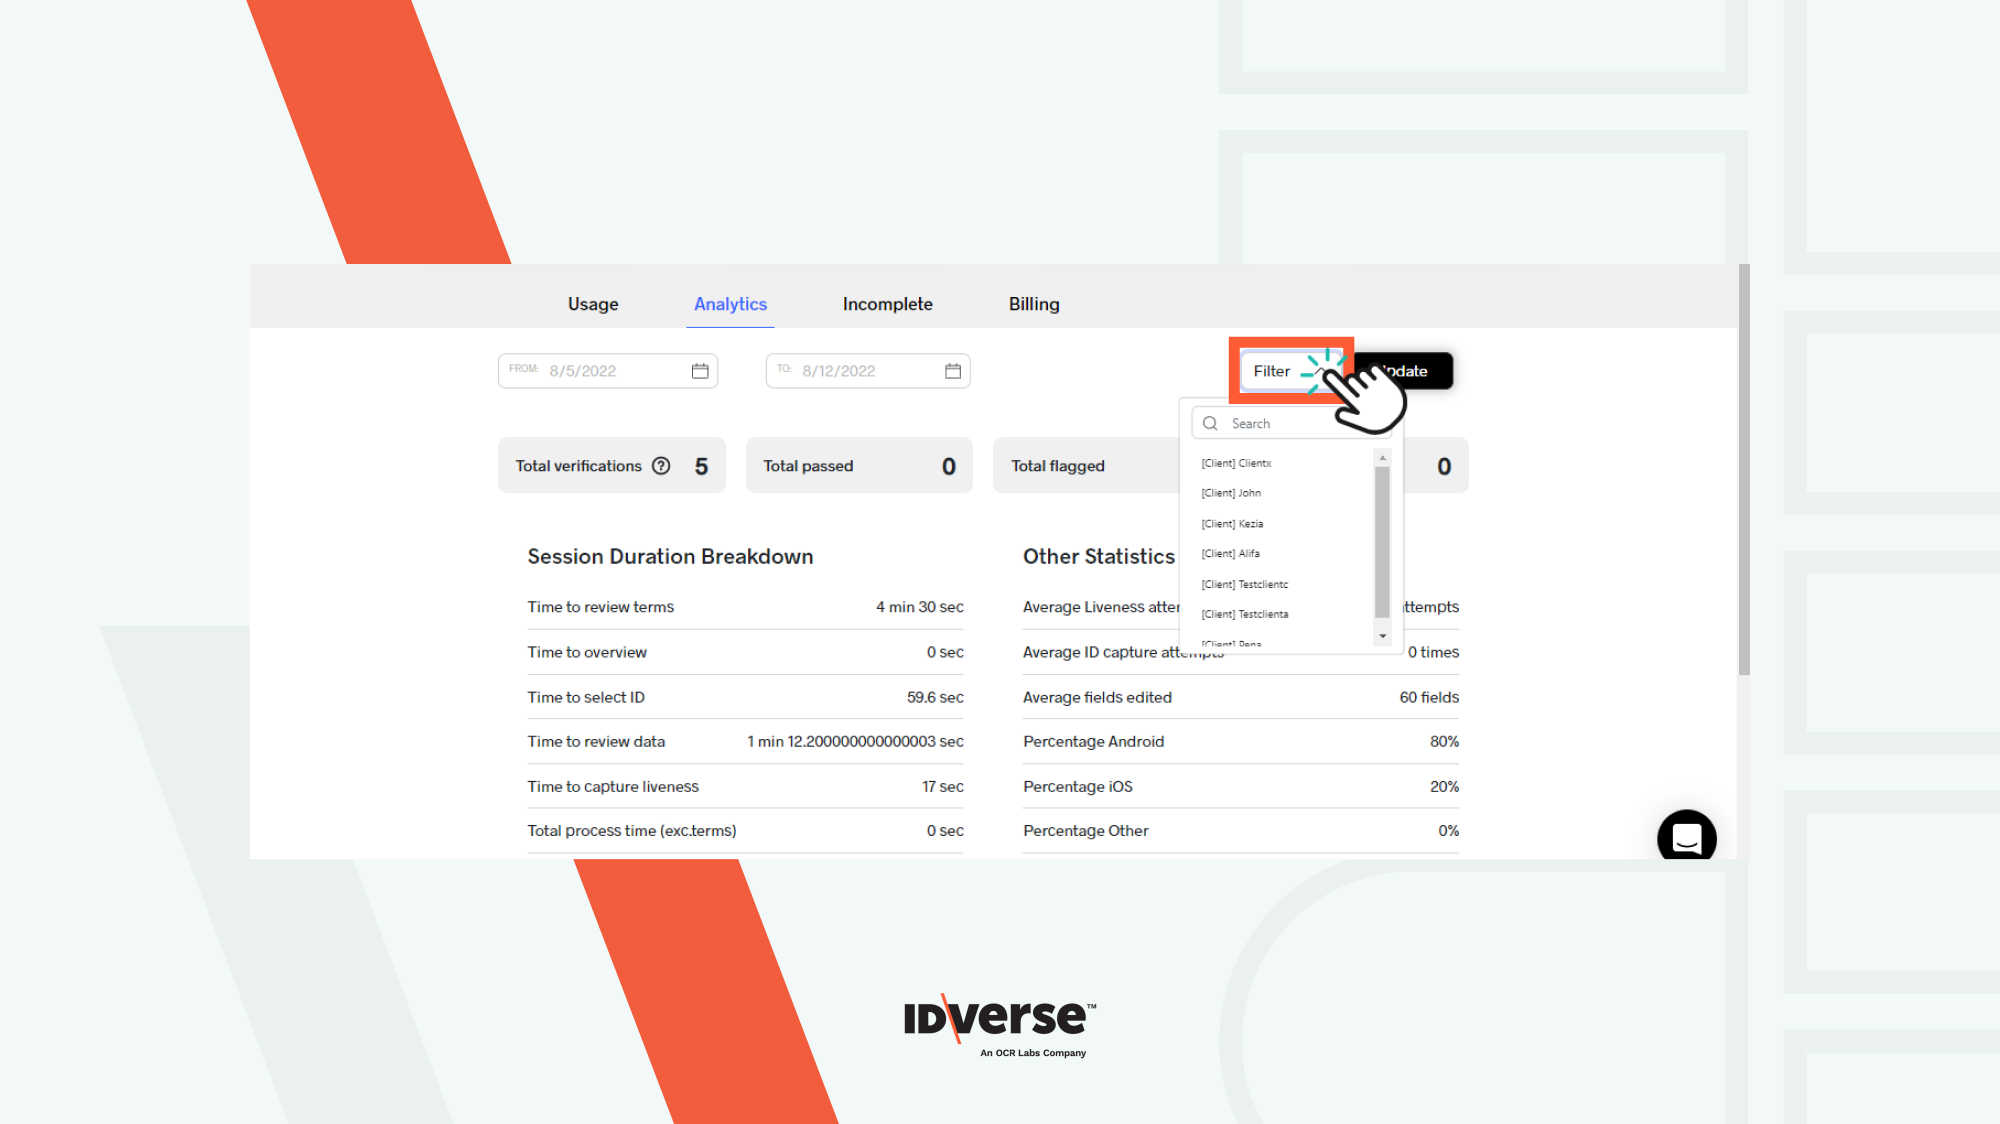
Note:
When the range of dates and client filter are all set, hit the Update button to get the results.
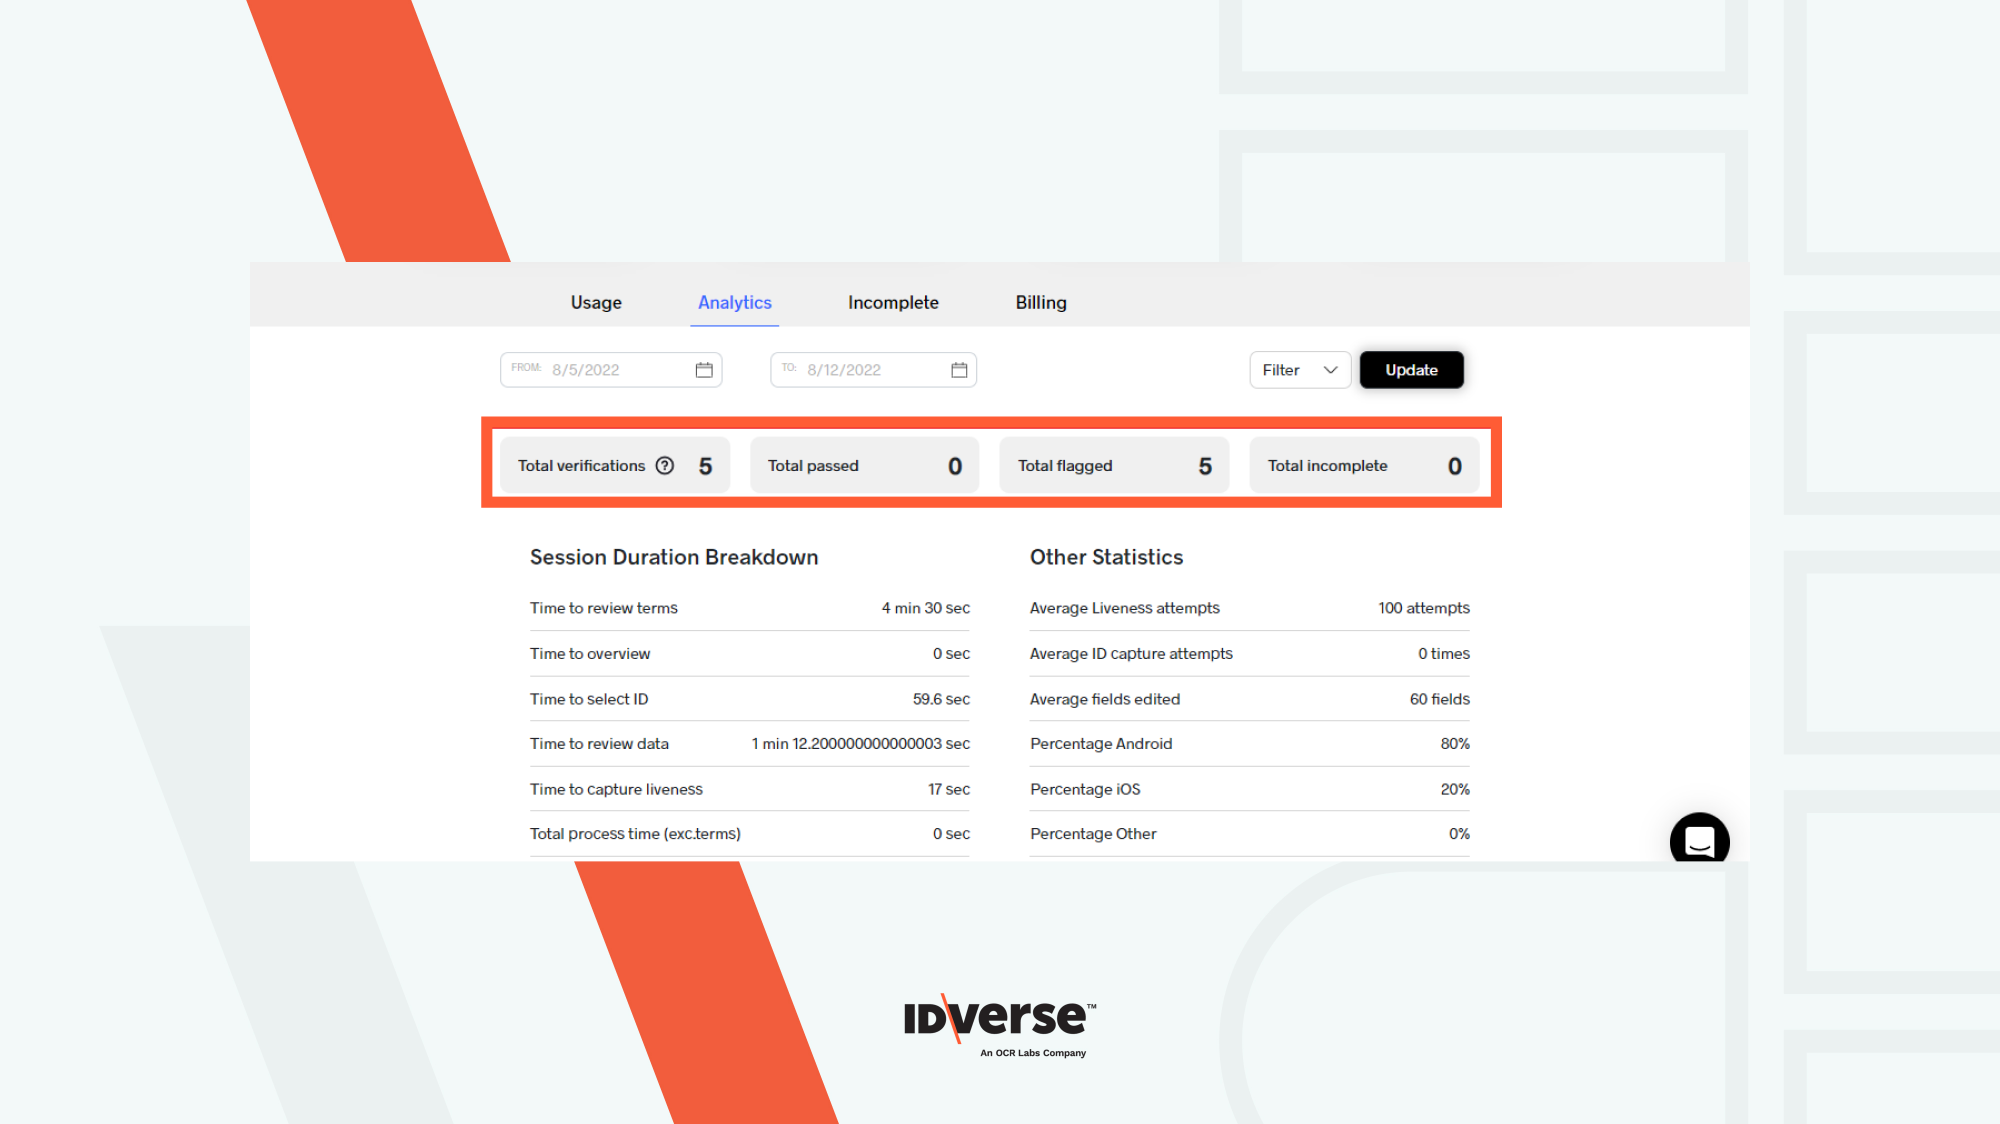
Verification Statistic
Verification Statistics show the total verifications created from the generated transaction links, categorized by the final verification results. We give the breakdowns as follows.
- Total Verifications: Total verifications by users, regardless of whether they were successful, expired, or canceled.
- Total Passed: All successful user verifications.
- Total Flagged: The scanned document considers All failed user verifications unmatched.
- Total Incomplete: All verifications that were expired or cancelled (verifications in progress are not included).
Analytic Report Breakdowns
The four main parts of this report are explained below.
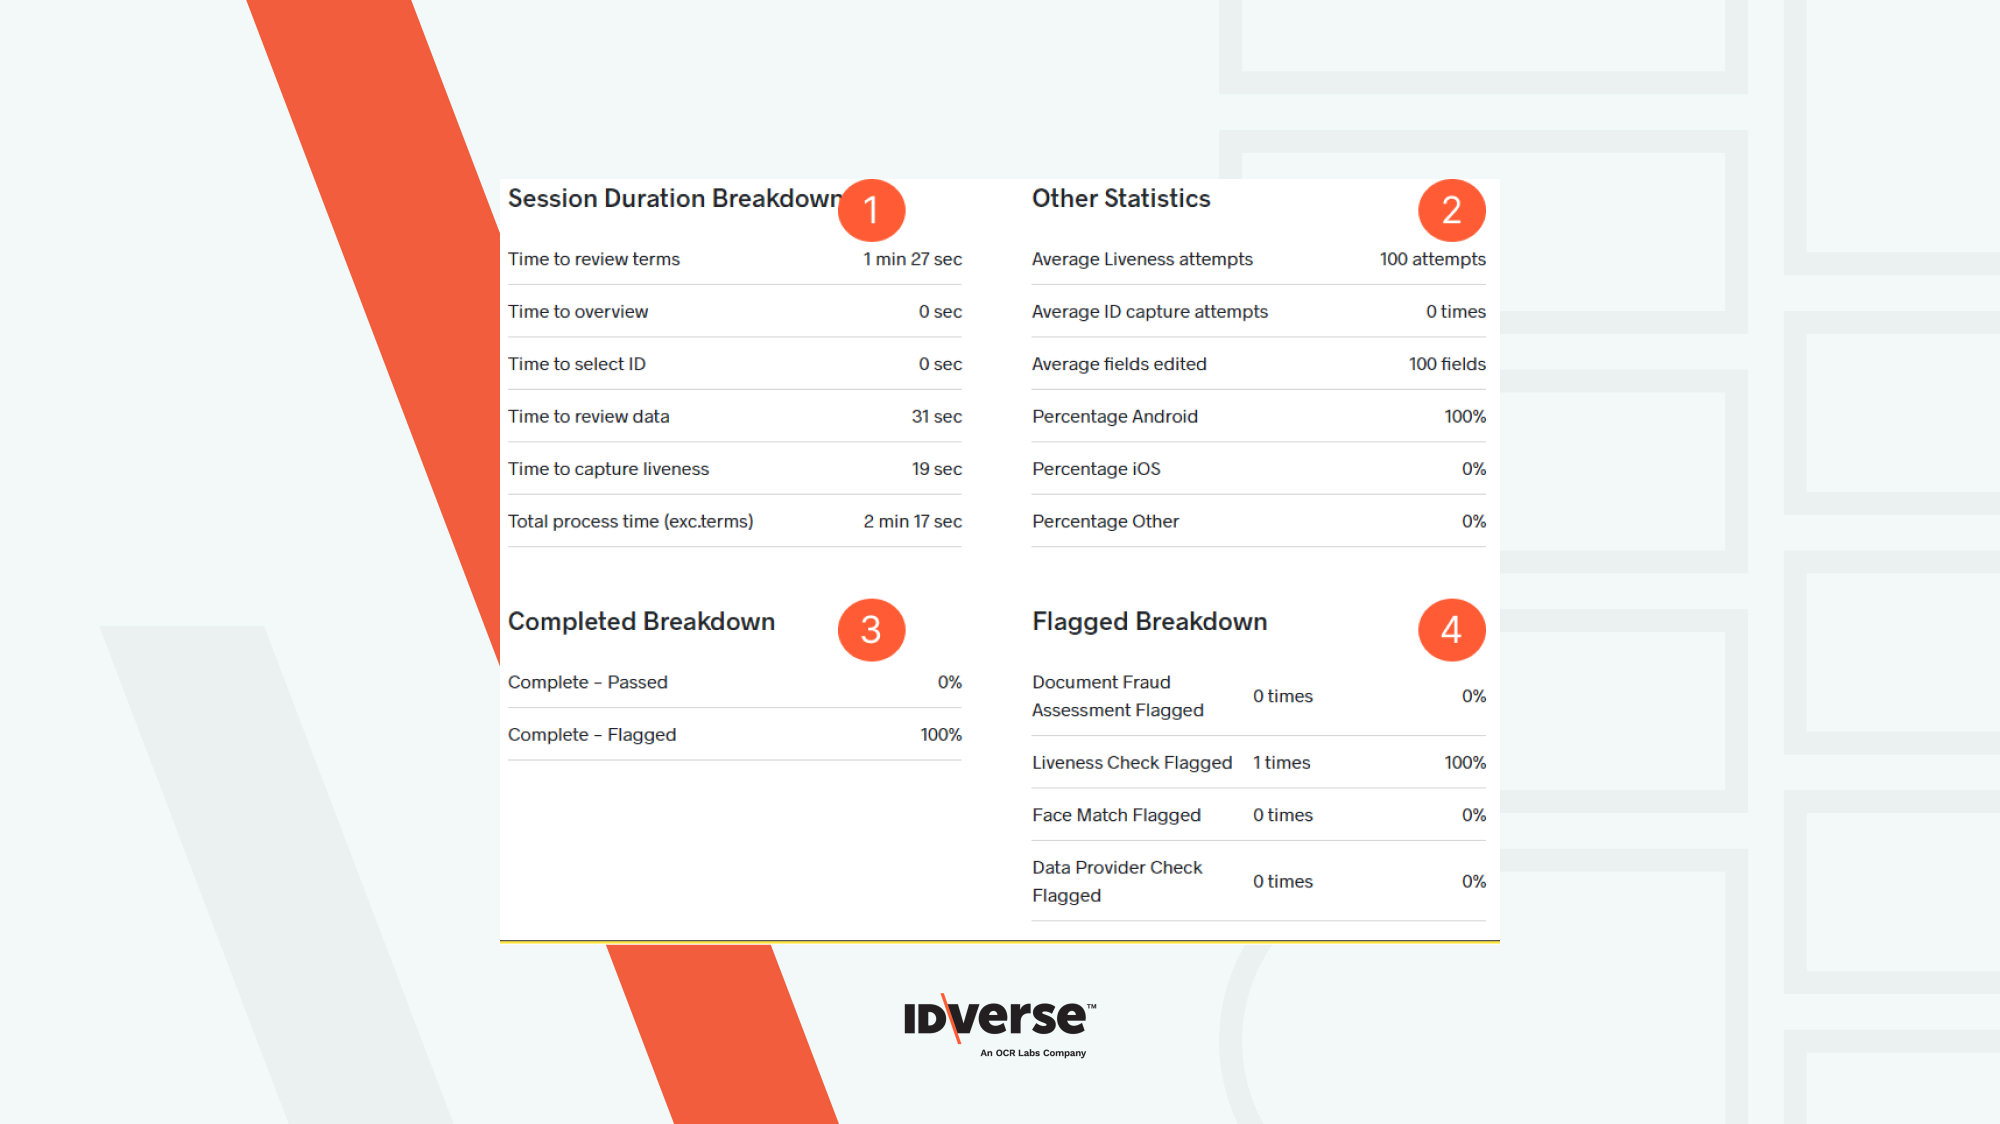
1. Session Duration Breakdown
This section contains summary data for the duration of user verification. See the details in the table below:
| Report | Description |
|---|---|
| Time to review terms | The time (in seconds) the user takes to review the terms and conditions. |
| Time to overview | The time (in seconds) the user takes on the overview page. |
| Time to select ID | The time (in seconds) the user takes to select the ID for verification. |
| Time to review data | The time (in seconds) the user takes to review the uploaded data. |
| Time to capture liveness | The time (in seconds) the user takes to make the liveness attempt. |
| Total process time (exc. terms) | The total duration (in seconds) of the whole verification process without terms reviewing duration. |
2. Other Statistic
This part includes a summary of the attempts and device utilization. See the table below for more information:
| Report | Description |
|---|---|
| Average Liveness attempts | An average number of video capture attempts. |
| Average ID capture attempts | An average number of ID capturing attempts. |
| Average fields edited | An average number of fields that users modified. |
| Percentage Android | A percentage of the Android devices that the users used when doing a verification. |
| Percentage iOS | A percentage of the iOS devices that the users used when doing a verification. |
| Percentage Other | The percentage of devices other than iOS or Android used by users when doing a verification |
3. Completed Breakdowns
This section includes the percentage summary of the completed verifications. There is a percentage for passed verification and flagged verification results.
The passed verification result represents a successful verification. On the other hand, the flagged verification result means a failed verification or a falsely verified user.
4. Flagged Breakdowns
This section contains a summary of the flagged verifications. See the details in the table below:
| Report | Description |
|---|---|
| Document Fraud Assessment Flagged | A percentage of document fraud assessment session failure. |
| Liveness Check Flagged | A percentage of liveness/video check failure. |
| Face Match Flagged | A percentage of failed face matches between the captured image/video and the ID uploaded. |
| Data Provider Check Flagged | A percentage of data providers check session failures. |